Big Wood River
Volume Forecasts
Volume Forecasts
()
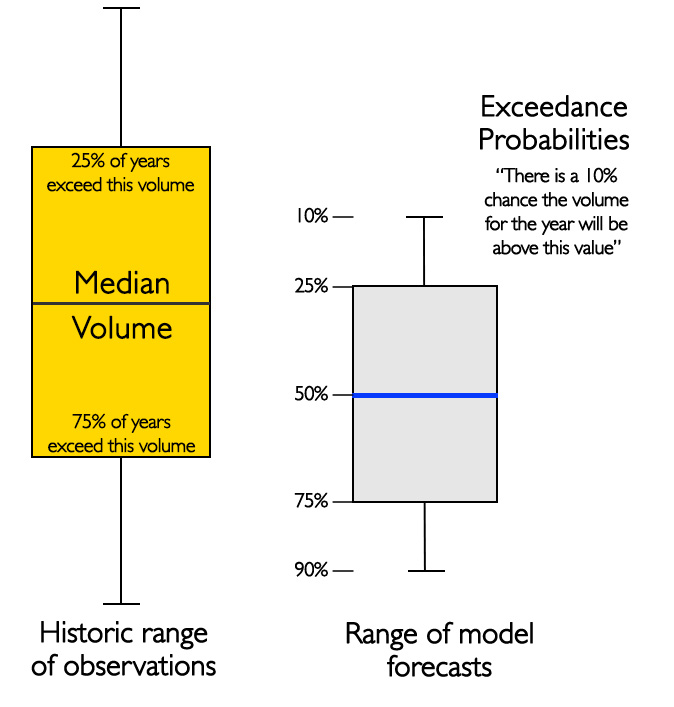
The streamflow forecasting tools predict total irrigation season runoff volume (April 1 – Sept 30) from February 1 to the end of April. Exceedance probabilities shown below are a way to evaluate the likelihood that a given amount of water will move past the gaging location. The 50% exceedance is the average forecast, while the 10% exceedance would mean that there is a 10% chance that the volume of water will be above that value. These probabilities are aligned with the Northwest River Forecasting Center (NWRFC) for comparison purposes. You can check out the daily NWRFC Hailey forecast here, and the beginning of the month NRCS forecasts for the Big Wood here.
Exceedance Probabilities:
Forecasted irrigation season streamflow volumes (KAF) with exceedance probabilities. The 50th percentile is the average forecast. These probabilities are aligned with the Northwest River Forecasting Center for comparison purposes.
Historic and Forecasted Irrigation Season Volumes
These boxplots show the range of irrigation season volume forecasted each day (blue) and the historic range of volumes (yellow) for each gage. The boxes represent the 25th – 75th percentiles (which account for 50% of the predictions), the solid red line in the middle is the median forecasted value. As the season progresses we can track how the forecasts change in response to watershed conditions. The models are more uncertain in February than later in March and April. The NWRFC model at Hailey is particularly helpful when we are expecting high streamflows and volumes which these models do not capture as well.
How to interpret boxplots
Streamflow forecasts are shown as boxplots in comparison to the range of historical conditions. The exceedance probabilities align with the Northwest River Forecasting Center probabilities for comparison. The median forecasted streamflow volume for each gage and the exceedance probabilities are shown in the table.